What is Visualisation for Renewables?
Although this page uses techniques already discussed on some of the preceding visualisation pages, we consider that it merits its own space due to the particular characteristics of wind and solar power.
Wind turbines
Apart from size and form, the single most obvious characteristic of wind turbines is the rotation of their blades. Static methods of representing turbines do not communicate this particular characteristic of continuous movement. Most windfarm visualisations are presented in print, for the purpose of Landscape and Visual Impact Assessment (LVIA) for EIA and Public Inquiry. However, computers and the Internet make new presentation methods possible and desirable, and in our view these methods should form part of the planning process.
We have tested a number of methods of presenting wind farms using animation methods - please click on the links to the right to see examples of both static and animated visualisation.
Solar farms
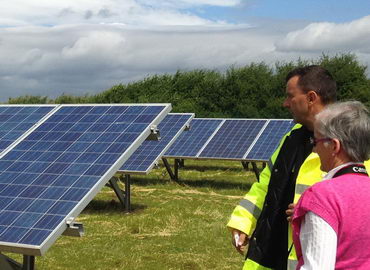
Solar installations are very different in character to wind - being inherently wide and low, rather than tall and narrow!
To represent solar farms it is often necessary to use panoramic photography and consequently to output matching panoramas of the solar arrays.
Other renewables
As part of LVIAs we have also provided visualisations of Anaerobic Digester (AD) plants, a biomass power station, and power lines that connect renewables.
Why 2B?
Bill's position on the Landscape Institute's Technical Committee, recognises and contributes to our position at the cutting edge of current thinking on these techniques.
We continue to refine these processes. You will find us easy and efficient to work with, and pleased to assist. If you require assessment or visualisation of wind or solar installations, get in touch.
We met last night and discussed your most helpful quote and proposal. All members were enormously impressed with the animated visuals of the photomontages which you have produced (myself very much included).


