Over the years I have searched for and tried many solutions for logging time spent on projects, admin tasks etc. I even developed my own, which was good, in that it popped up every hour, allowed projects and notes to be entered and saved directly to a database - so we always knew how our time had been spent. However, it was functional rather than attractive.

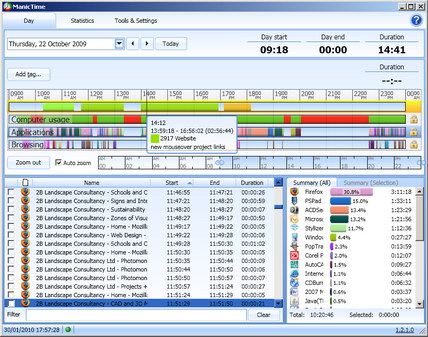
So I have to take my hat off to a lovely piece of work called ManicTime, which does an amazing job of graphical information presentation. This program continuously logs applications, browser activity etc on a time-line. Using these auto-logged activities, you can identify and allocate lengths of time to specific projects on the top "Tags" row. You can also add notes to each Tag.

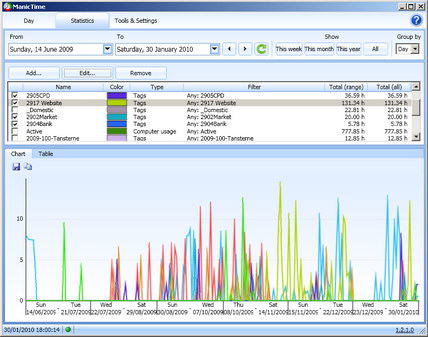
On the Statistics page, you can then view a summary of your activity Tags (or indeed any of the auto-created tags) by day, week, month or year.

This gives you a visual impression of where all that time went, as well as the ability to drill down into any period and see what was happening. The view above shows a lot of activity (in green) developing this website prior to Christmas 2009.

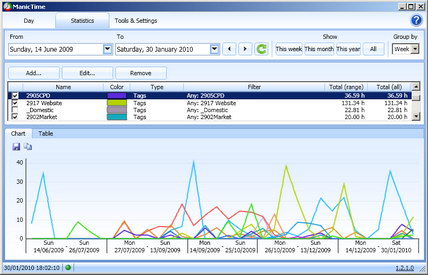
And here is the same date range, but with the data grouped into weeks, not days, which makes the overall pattern easier to see.
You can also summarise activity for any Project between any two dates, and export a CSV-format file, for import into a spreadsheet or database.
This is excellent software and the developer deserves praise and support. There is a free version and a slighty more sophisticated paid version. I hope that ManicTime continues to be developed - it is already a great program, but it could do even more in future. It has completely changed the way we record time spent on projects - now we know "where all the time goes"! We record our time more accurately and easily than ever before, which is good for us and our clients.